Playing With Trendlines Crude has Breached The Short-term trendline Support at 83 and tested the next Support at previous Bottom of 82.5 making a double bottom at that Same Place , Sustained Trading below Same Can Lead to Next Support Imp at 81.8 Below that Can Retest 79.8 * 77 $ Supports
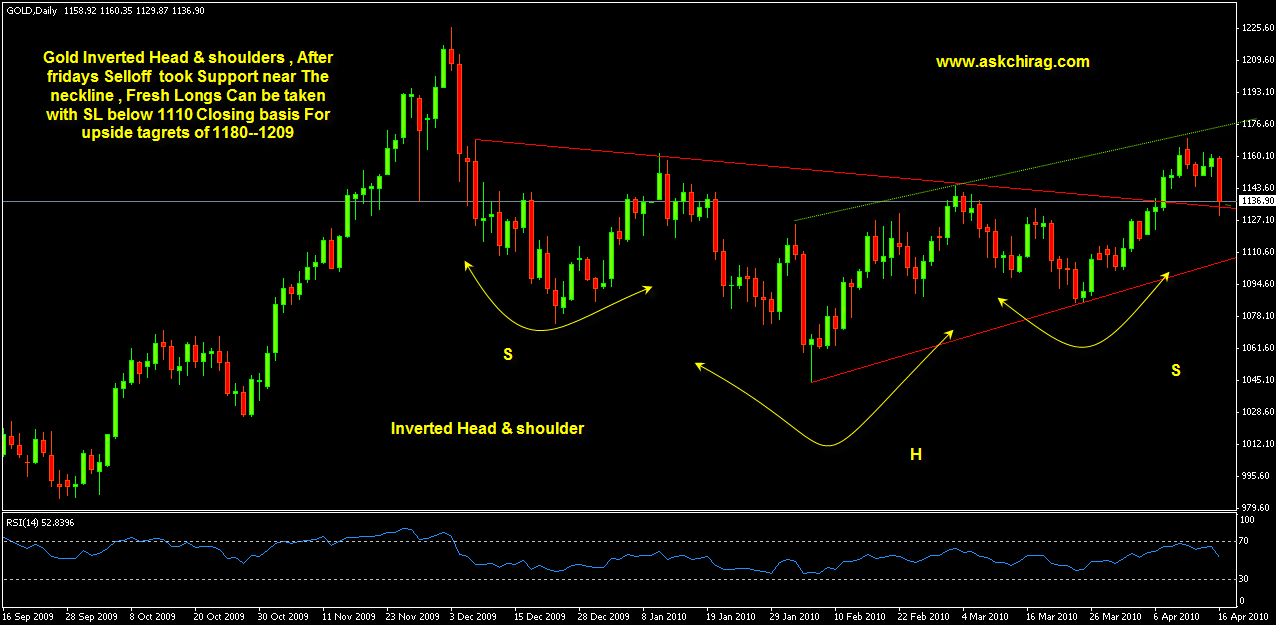
Gold Inverted Head & shoulders , After fridays Selloff took Support near The neckline , Fresh Longs Can be taken with SL below 1110 Closing basis For upside tagrets of 1180--1209
Crude has formed a Hanging Man - Doji at top end of end of channel which is a whiplash near the top end of channel Resistance . Indicating that a Short Term top May be in place. Failure to Close abv 87 in next day or two Could drag it down to sub 82 lvls . The RSI has also Started pointing downwards again after Hitting the Overbought Zone
Reco : Short on Rise With SL above 87.3 with downsid etargets of 83.5 & 82
( Click on Read Rest of entry & click on Graph to have Larger view of Charts )
Euro On 4 hours Charts has formed Strong Doji near the Resistance Zone indicating Trend Reversal possible , Could again Fall back to1. 3500 lvls In turn pulling Down , Precious Metals & basemeatls along with it -- Fresh Longs only to be taken in if Euro manges to Cross 1.3800
Gold possible IHS on daily comex charts -- Neckline placed at 1137 $ , Close and Sustained Trading abv Same can open upside trgt till 1160--1174 in short term , Failure to Cross Same could Lead to Retest on downside again till 1110 $
Gold Strong Resistance near 1125--1132 Zone in Near Term,
Looking at the Daily Charts of Gold in Medium term It has been moving in a Sideways downward biased Channel , the top end of the Channel is now near the 1123--1125 Zone Which will be A Strong Resistance to Cross ( Marked with PINK Lines on the Chart)
and in the Short term it has been Moving in a triangle (marked with orange Lines) So break above 1126 Zone Would Face Resistance at 1132 Where the upward Rising trend line of triangle is based. Which indicates that Fresh longs Should be taken if the Daily Close Manages to Close above 1132 levels for upside target of 1163--1174 targets , On Downside break of 1102 Will again indicate that the trend is Reversing again to Retest the Downward end of channel with Breakdown from the triangle opening Downside target till 1088--1065 $ -1044$ - 1005 $ , which Would possibly Mean the end of Short Term Zigzag Correction
The Leading indicators on Daily & 4 hours Charts have shown a Cross Over on the Downside from overbought Zones, Indicating some Shorts Are Being Created near Current levels
www.askchirag.com
For Subscription Details Add Yahoo id chiragkb5 or Call 9769980696 Email : info@askchirag.com
Silver has been moving in a Expanding triangle and wave count shows a Possible Start of third Wave with EURO also Supporting as far 15.65 Holds on closing Basis one can Expect an upside target of 17.55 lvls
Euro Does Double Bottom on Daily Charts , with the Second candle as Hammer and Some Follow up buying Coming up , The Following day - This Indicates that a Short Term bottom is in place and Some Retracement till 1.4000 lvls Cant be Rulled out , Look to Buy on Dips till 1.3400 is Held
An upmove in Euro Could Lead to Rise in PM metals Also Opeing an upside trgt of Gold till 1160 & slvr 16.8--17.35 Zone